Color, Vision, Image Processing Notes
Some notes for Myself! :-)
Tuesday, July 29, 2014
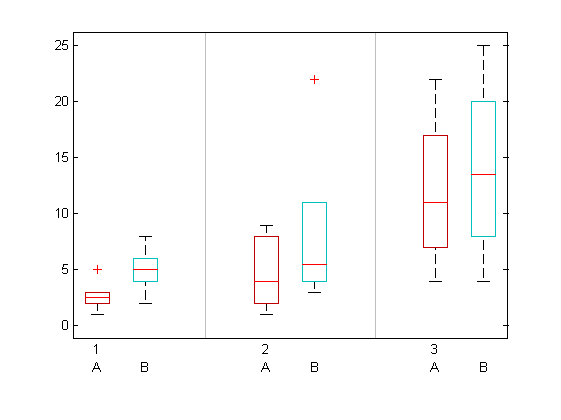
Side by Side boxplot in MATLAB
I have found the following code somewhere in the internet but forgot to keep track of the link. Anyway, its for you!
See below the MATLAB code that generates this figure!
No comments:
Post a Comment
Please ask if anything is not clear enough..........
Newer Post
Older Post
Home
Subscribe to:
Post Comments (Atom)
No comments:
Post a Comment
Please ask if anything is not clear enough..........