Showing posts with label matlab. Show all posts

Tuesday, July 29, 2014

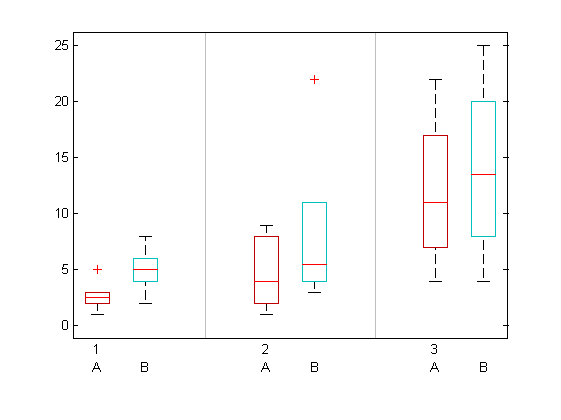
Side by Side boxplot in MATLAB

I have found the following code somewhere in the internet but forgot to keep track of the link. Anyway, its for you!
See below the MATLAB code that generates this figure!


Saturday, July 26, 2014

Convert RGB to CIE LAB with explanation, MATLAB example


In this tutorial. I have explained what is RGB and CIE LAB color space. Then, I have shown an example in MATLAB where I converted an image from sRGB to LAB


Tuesday, July 15, 2014

How to Create Zero Mean white Gaussian Noise in MATLAB

You can create zero mean Gaussian Noise using the randn function. It is also known as white noise.
See the following script.

Thursday, July 11, 2013

Compute Trimean from Quantile in Matlab

Since, Trimean is robust to outliers, it is recommended as summary statistics instead of simple mean. Let us give an example.

 x = [2 5 6 10 11 13 200];

In this example, taking a mean is heavily influenced by outlier value 200

mean(x)

ans =

    35.2857

But is there any better summary statistics than taking just direct mean?

Q = quantile(x,[0.25, 0.5, 0.75])

Q =

    5.2500   10.0000   12.5000

Note that here Q(2) is the median. And, Q(1) and Q(3) are first and third quantile respectively.

Now, we can compute the trimean by the weighted sum of quantiles. Median gets the higher weight since its the most robust quantile among three.

 0.25*Q(1)+0.5*Q(2)+0.25*Q(3)

ans =

    9.4375

This trimean represent x which is a better summary statistics than simple mean. 
Tuesday, January 29, 2013

simplest way to use EXR in MATLAB


How to read/write EXR images in MATLAB?
1.       You can Install HDRITOOLS from here (https://bitbucket.org/edgarv/hdritools/downloads); Choose *x64.msi or *.x86.msi based on your current MATLAB installation
2.       Say install location of HDRITOOLS is ~Documents\MATLAB\HDRIToolsx64\matlab, here please try reading a EXR file using following command

info=exrinfo('A003C001_120626W700021.exr');
info.channels
info.channels(1) % prints out the name of the first channel
info.channels(2) % prints out the name of the second channel
info.channels(3) % prints out the name of the third channel
c1=exrreadchannels( 'A003C001_120626W700021.exr',info.channels(1) ); % reading first channel

Wednesday, January 23, 2013

Finding a vector within a matrix

Imagine, I have a matrix called RGB (list of some colors) like the following 

RGB=[1 2 3; 4 5 6; 7 8 9; 10 11 12; 0 0 0; 1 2 5]

RGB =

     1     2     3
     4     5     6
     7     8     9
    10    11    12
     0     0     0
     1     2     5

I would like to find whether vector [ 1 2 5] is available in RGB or not?

The fastest way is to do some logical operation.

loc =  (RGB(:,1)==1 & RGB(:,2)==2 & RGB(:,3)==5 )

loc =

     0
     0
     0
     0
     0
     1

So now we know where is the vector [1 2 5] is located. We can find its index or even how many times it occurs by manipulating above loc vector

Wednesday, January 16, 2013

removing a vector [0 0 0] from a matrix M

Imagine a matrix M having some [0 0 0] vector like the following which I want to remove 

>> M=vertcat([0 0 0],magic(3),[0 0 0])

M =

     0     0     0
     8     1     6
     3     5     7
     4     9     2
     0     0     0
The easiest way to do it is the following 
Step 1. find the logical row positions which have [0 0 0] entries by where all(M==0,2) means looking for zero entries in row dimension


>> zero_position=all(M==0,2)

zero_position =

     1
     0
     0
     0
     1

Step2: Clean the zero entry rows!


>> M(zero_position , : )=[]

M =

     8     1     6
     3     5     7
     4     9     2


Wednesday, July 11, 2012

How to plot color in 3D RGB color space?

Problem: Randomly select some colors from an sRGB image and plot them in 3D RGB color space having true RGB values as present in the image
***************************************************************************
The following code will pick some random 5% color from Fig1. Then it plots those colors in 3D RGB color space which is shown in Fig2. Enjoy!


Fig1: A test image named 'pepper.png' and we would like to plot some colors of this image into RGB color space

True RGB values in RGB color space coming from image (pepper.png)


Today's homework: Please convert this RGB colors into LAB color and plot in 3D Lab color space. 
Hint: Use makecform and applycform of MATLAB for color space conversion


Friday, June 29, 2012

How to remove zeros from a vector?

Imagine you have the following vector and you want to remove the zero values

 X=[6 8 0 4 6 8 9 0 9 7 7 ]

X =

     6     8     0     4     6     8     9     0     9     7     7


The following command will remove the zero values

 X(all(X==0,1))=[]

X =

     6     8     4     6     8     9     9     7     7

Why choice of white point matters?

Imagine you have a sRGB image and you would like to convert it into lab color space.
So, how does it work ? It is calculated in two main steps
  1. sRGB to XYZ color space
  2. XYZ to Lab color space
During this color space conversion one of the major choice is the adapted white point. Let me show an example why adapted white matters! let us use the following image.
Fig 1: We will use this "peppers" image to show how choice of white point matters.
Please run the following code
I=imread('peppers.png');
figure, imshow(I);
srgb2lab_byA = makecform('srgb2lab', 'AdaptedWhitePoint',whitepoint('a'));
srgb2lab_byD50 = makecform('srgb2lab', 'AdaptedWhitePoint',whitepoint('d50'));
lab_A = applycform(I,srgb2lab_byA); 
lab_D50 = applycform(I,srgb2lab_byD50); 
figure;
subplot(1,2,1),imshow(lab_A(:,:,1)); title('sRGB to Lab by adapting to illuminant A');
subplot(1,2,2),imshow(lab_D50(:,:,1)); title('sRGB to Lab by adapting to illuminant D50');
luminance_diff=abs(lab_A(:,:,1)-lab_D50(:,:,1));
figure;% luminance difference is 40times enhanced for visualization
imshow(luminance_diff*40); title('luminance channel difference(40times enhanced for visualization) between A and D50');
Fig2 : sRGB2LAB conversion using illuminant A vs using illuminant D50


Since it is hard to see the difference from the above image, we can plot their difference


Fig3: Luminance difference while converting sRGB2lab using illuminant A vs illuminant D50; Original difference  is multiplied with 40 for visualization only


Friday, January 27, 2012

Mean Shift Clustering/ Segmentation in Matlab

The Mean shift implementation in here is based on the following article. 

Comaniciu, Dorin; Peter Meer (May 2002). "Mean Shift: A Robust Approach Toward Feature Space Analysis". IEEE Transactions on Pattern Analysis and Machine Intelligence (IEEE) 24 (5): 603–619


The original C++ implementation credit goes to here.
Matlab wrapper implementation credit goes there. Read this readme before using this wrapper :) Thanks also goes here.

I faced some troubles during the compilation of "compile_edison_wrapper" where i had used visual studio 2010 as a compiler. 

Here are two problems that I have faced !

Problem 1: end of file of the c++ code is in Mac format. 
solution: After opening *.h or *.cpp in visual studio save them with advanced options....choose windows style end of file.

Problem 2: pow function from math is ambigious. 
solution: convert the first parameter of pow into double. 

Here is my corrected version EDISON matlab wrapper (Click File-->Download) Try the do_mean_shift.m. 
Try 
MinimumRegionArea=40;
I=imread('yourimage.jpg');
[fimg labels modes regsize] = edison_wrapper(uint8(I),@RGB2Luv,'MinimumRegionArea',MinimumRegionArea);


A sample result should look like the following.


Monday, December 12, 2011

In Matlab, How to use a function within a function without creating another fun_name.m file?

The following info might be obvious to you!

Well, you know usually in matlab, each function has to be declared into a separate fun_name.m file. In this case the objective is to allow other scripts to call this function.

But, if I need a function to be used inside a function which does not need to be called from the outside then how to do that?

It's damn obvious but I needed some time to figure it out :-)

function return_val=function_to_be_called (parameters of function_to_be_called )

% main code for function_to_be_called
% Here You may call internal_function

function val=internal_function (parameters of internal_function )
% your code
end % end of internal_function

end % end of function_to_be_called 

Friday, December 9, 2011

Binary Operation on an Array in MATLAB

Let's imagine that I have the following array (double type). I want to run a binary operation to pick only those columns that are TRUE according to another binary(logical) array :-)


>> A=[1:2:20]
A =
     1     3     5     7     9    11    13    15    17    19

I want to run a binary operation on this array based on the following array Binary_B
>> Binary_B=[ 1 0 1 1 1 0 0 1 1 0]

Right now, Binary_B is also double type. So to convert it into binary format we have use the command "logical"

>>Binary_B=logical(Binary_B)

Now just run the following command to pick only the columns of A where the binary value is 1. I have found this simple command very useful.


>> A(1,Binary_B)

ans =

     1     5     7     9    15    17


Thursday, October 13, 2011

Color Channel separation in Matlab

RGB color channel separation for a 3-channel-truecolor RGB image.
Matlab can read an image by imread
For example let's read the image called "3_channel_color_image.png"


This will create a (xdimension_img X ydimension_img X 3) array into matlab workspace called color_img.

Now to separate three channel from that color image we can do the following


Now, lets see the images of the three channel using imshow